

Well, Prometheus is a tool that can monitor the microservices and applications using the pull mechanism . A key reason Prometheus is so popular and versatile is the availability of Prometheus Exporters. Prometheus Exporters are utilities that run alongside the application environment that a Prometheus instance monitors. The Prometheus instance scrapes the exporter for crucial application and infrastructure-level metrics.
There are multiple different exporter . in this blog post will focus on BlackBox exporter .
Blackbox Exporter gives you the ability to probe endpoints over HTTP, HTTPS, DNS, TCP and ICMP.
For example, with HTTP and HTTPS, you can monitor websites to ensure:
- Which endpoints that have replied HTTP status code is 2xx.
- They return a certain string. Example: check that the title of the webpage is the one you except.
- TLS certificates (aka SSL/HTTPS) are valid. Example: retrieve the expiration date to avoid any renewal certificate problem.
- They respond fast. Example: how long the DNS resolution took, mesure the TLS handshake etc...
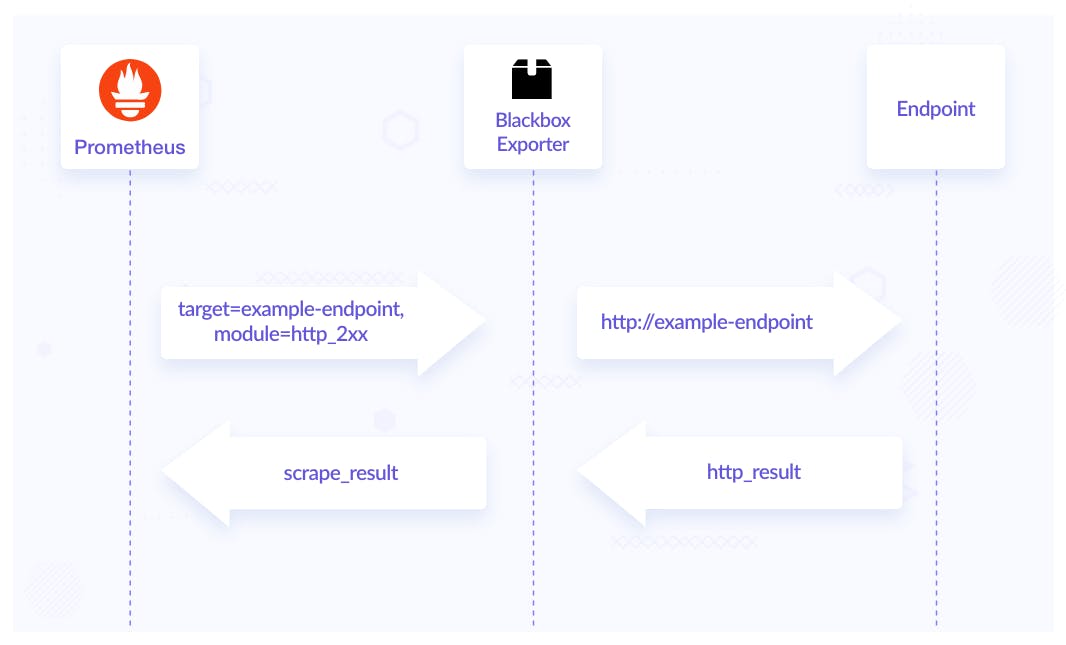
The following diagram shows the flow of Blackbox Exporter monitoring an endpoint.
1. Installing and Configuring Blackbox Exporter in Kubernetes.
We will be using the prometheus-community/prometheus-blackbox-exporter Helm chart to install Blackbox Exporter. BlackBox Exporter chart.
helm repo add prometheus-community https://prometheus-community.github.io/helm-charts
helm repo update
create values.yaml with below sample config.
config:
  modules:
    http_2xx:
      prober: http
      timeout: 5s
      http:
        valid_http_versions: ["HTTP/1.1", "HTTP/2.0"]
        follow_redirects: true
        preferred_ip_protocol: "ip4"
install BlackBox exporter with values.yaml file .
helm install prometheus-blackbox prometheus-community/prometheus-blackbox-exporter -f values.yaml
2. Add Prometheus config to probe external targets .
Prometheus is required for BlackBox exporter . Please find how to install Prometheus using Helm chart .
- using a static : We can probe static targets in Prometheus so BlackBox exporter can scrape as below :
- job_name: 'BlackBox-static-targets'
  metrics_path: /probe
  params:
    module: [http_2xx]
  static_configs:
    - targets:
      - https://www.google.com
      - https://yahoo.com
  relabel_configs:
    - source_labels: [__address__]
      target_label: __param_target
    - source_labels: [__param_target]
      target_label: instance
    - target_label: __address__
      replacement: prometheus-blackbox-exporter:9115 # make sure that you're using the corret svc of blackbox exporter service .
- Add Prometheus config to probe services.
    - job_name: "BlackBox-kubernetes-services"
      metrics_path: /probe
      params:
        module: [http_2xx]
      kubernetes_sd_configs:
      - role: service
      relabel_configs:
         - source_labels: [__address__]
          target_label: __param_target
        - target_label: __address__
          replacement:  prometheus-blackbox-exporter:9115 # make sure that you're using the corret svc of blackbox exporter service .
        - source_labels: [__param_target]
          target_label: instance
        - action: labelmap
          regex: __meta_kubernetes_service_label_(.+)
        - source_labels: [__meta_kubernetes_namespace]
          target_label: kubernetes_namespace
        - source_labels: [__meta_kubernetes_service_name]
          target_label: kubernetes_service_name
- Add Prometheus config to probe ingress.
    - job_name: "BlackBox-kubernetes-ingresses"
      metrics_path: /probe
      params:
        module: [http_2xx]
      kubernetes_sd_configs:
      - role: ingress
      relabel_configs:
        - source_labels:
            [
              __meta_kubernetes_ingress_scheme,
              __address__,
              __meta_kubernetes_ingress_path,
            ]
          regex: (.+);(.+);(.+)
          replacement: ${1}://${2}${3}
          target_label: __param_target
        - target_label: __address__
          replacement: prometheus-blackbox-exporter:9115 # make sure that you're using the corret svc of blackbox exporter service .
        - source_labels: [__param_target]
          target_label: instance
        - action: labelmap
          regex: __meta_kubernetes_ingress_label_(.+)
        - source_labels: [__meta_kubernetes_namespace]
          target_label: kubernetes_namespace
        - source_labels: [__meta_kubernetes_ingress_name]
          target_label: ingress_name
- Add Prometheus config to probe pods
    - job_name: "blackbox-kubernetes-pods"
      metrics_path: /probe
      params:
        module: [http_2xx]
      kubernetes_sd_configs:
      - role: pod
      relabel_configs:
         - source_labels: [__address__]
          target_label: __param_target
        - target_label: __address__
          replacement:  prometheus-blackbox-exporter:9115 # make sure that you're using the corret svc of blackbox exporter service .
        - source_labels: [__param_target]
          replacement: ${1}/health
          target_label: instance
        - action: labelmap
          regex: __meta_kubernetes_pod_label_(.+)
        - source_labels: [__meta_kubernetes_namespace]
          target_label: kubernetes_namespace
        - source_labels: [__meta_kubernetes_pod_name]
          target_label: kubernetes_pod_name
How to graph the data?
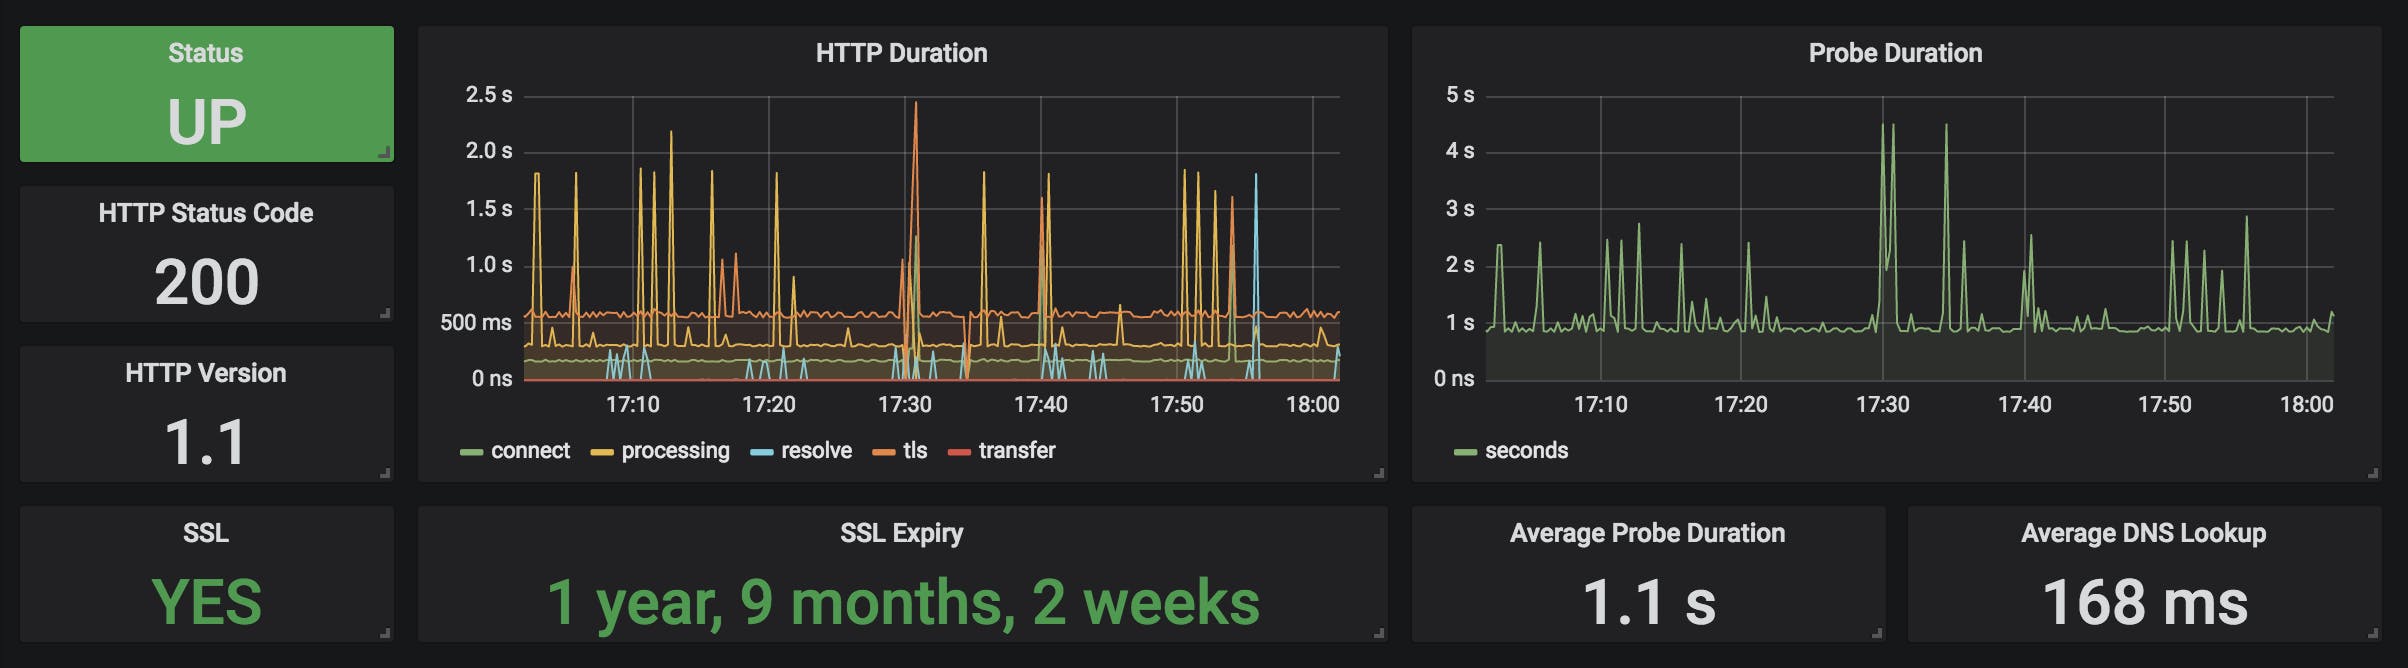
Blackbox comes with a web UI that gives some information about the checks. Grafana is perfectly integrated with Prometheus .
Multiple dashboards exist today to format the data in human-readable graphs. Two of them are particularly interesting:
9115-blackbox provides a big overview of all the monitored endpoints in a single table to quickly get the status of each one.
Prometheus Blackbox Exporter provides an overview of each monitored endpoint in a dedicated section for each one.
For more information on Prometheus Blackbox: