


Table of contents
Hello,
I'm using Prometheus operator in my kubernetes cluster so you can define your Monitoring with same way in yaml . So i was trying to use Kind: Probe to add Blackbox exporter to prometheus using CRDS instead of adding static config each time to prometheus .
---
apiVersion: monitoring.coreos.com/v1
kind: Probe
metadata:
  labels:
    app.kubernetes.io/component: exporter
    app.kubernetes.io/name: blackbox-exporter
    app.kubernetes.io/part-of: kube-prometheus
    release: kube-prometheus-stack
  name: demo-probe
  namespace: monitoring
spec:
  module: http_2xx
  prober:
    url: prometheus-blackbox-exporter.monitoring.svc:9115 # make sure you're using correct blackbox exporter svc .
  targets:
    targets:
    staticConfig:
      static:
        - https://google.com
       - https://yahoo.com
Note :
i'm using kube-promtheus-stack chart to install promtheus so make sure that you're using the correct label added to Probe Object without it Prometheus Service will not able to scrape Probe .
release: kube-prometheus-stack
you can get the right label selector by running below :
kubectl get prometheuses.monitoring.coreos.com kube-prometheus-stack-prometheus -oyaml
find the probeSelector :
probeNamespaceSelector: {}
  probeSelector:
    matchLabels:
      release: kube-prometheus-stack
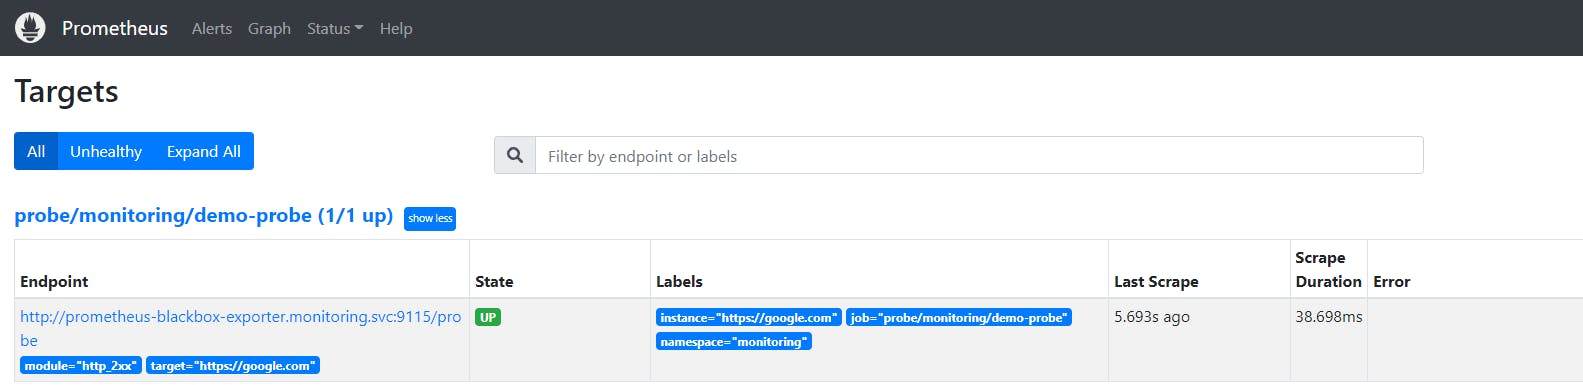
check if Prometheus is able to find BlackBox probe .
Go to your Prometheus Dashboard then targets .
Resources:
https://github.com/prometheus-community/helm-charts/issues/408